Image file
Noise reduced diagram
Summary
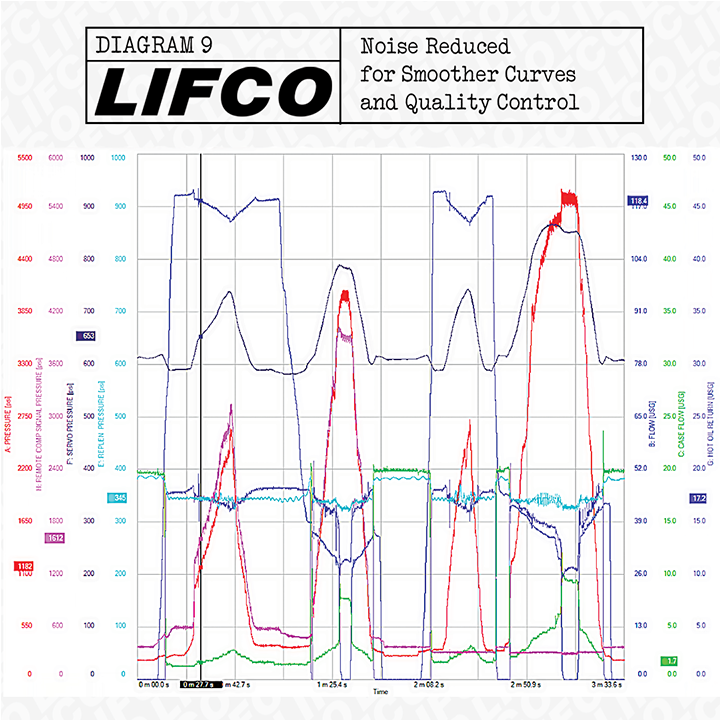
Diagram 9: the same V14 test-stand chart with the flow-meter noise filtered out, giving smooth pressure, flow and speed curves for the quality control test report
Image file
Diagram 9: the same V14 test-stand chart with the flow-meter noise filtered out, giving smooth pressure, flow and speed curves for the quality control test report